
Purpose
Learn how to define detailed project network activities and key milestones under WBS elements, assign work sequences and dependencies, and evaluate project schedules using visual Gantt charts in IndustryX Suite ERP.
Instructions
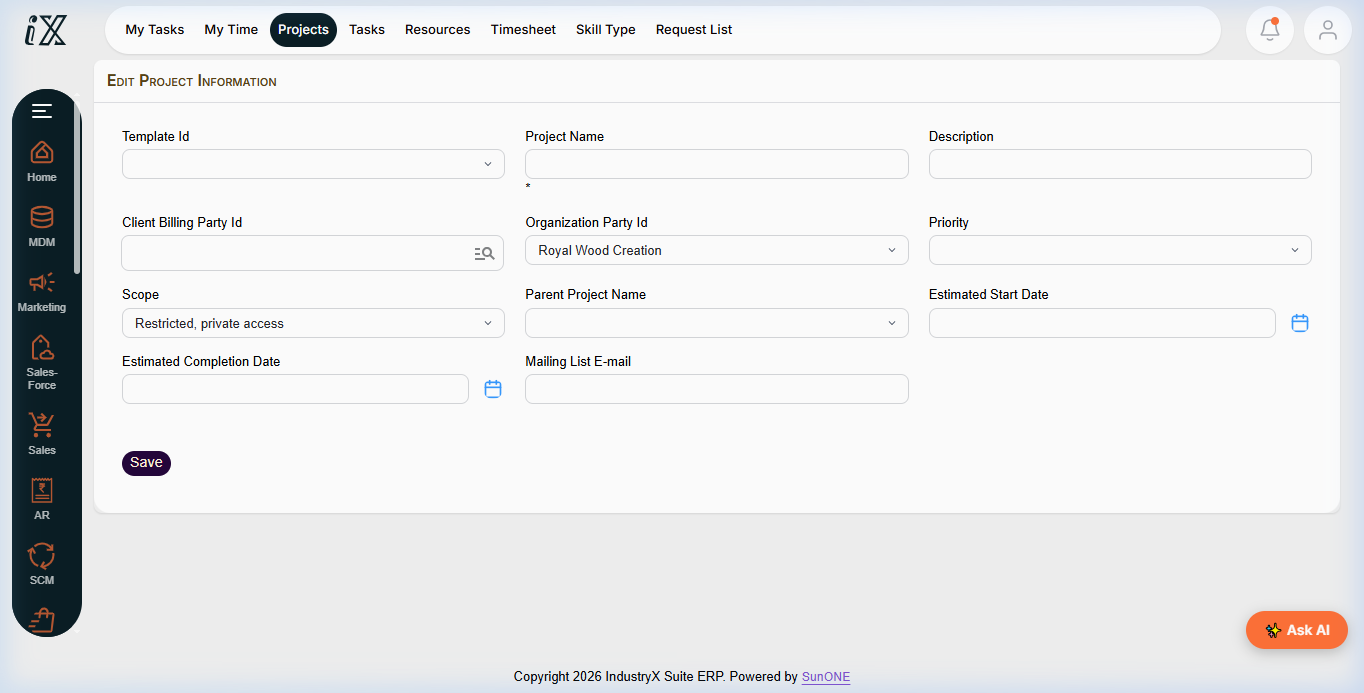
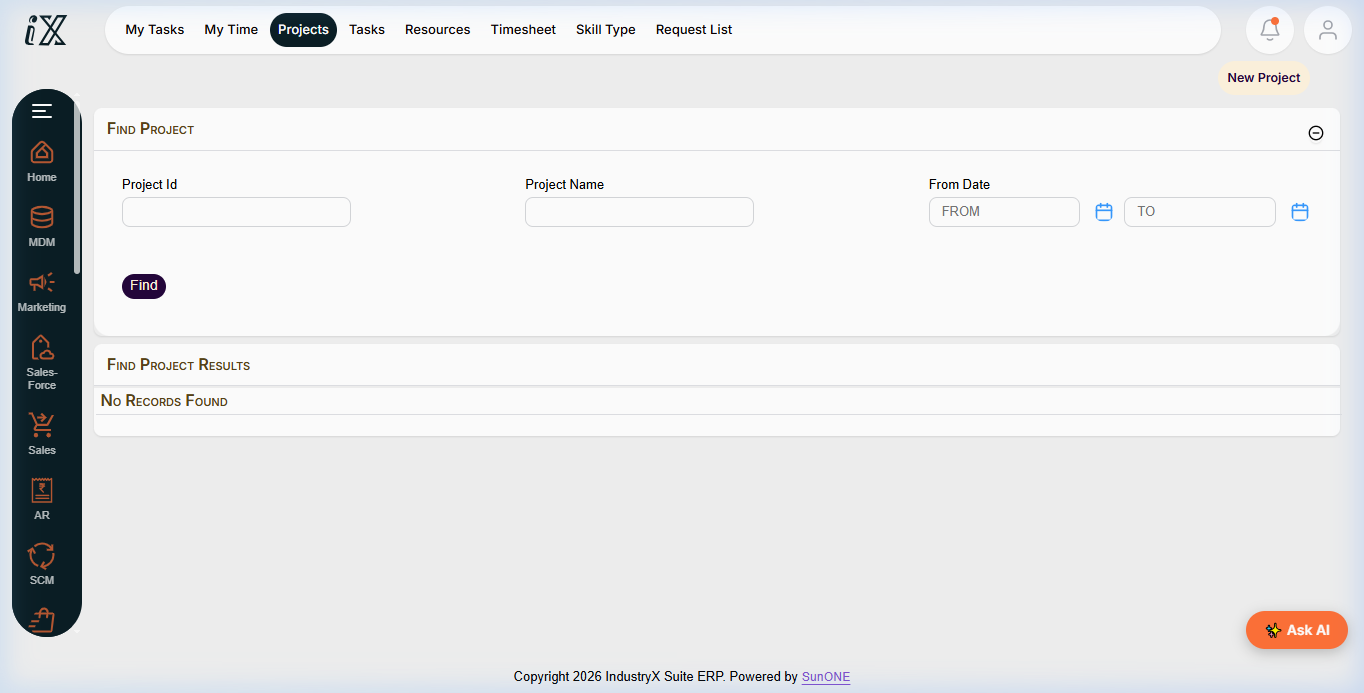
- Navigate to Project Manager > Find Projects and open the target project (e.g.
9000orPRJ10000). - Click the Tasks / WBS tab to view existing project activities and hierarchy.
- Select Add Task under the appropriate WBS phase (e.g.
Structural Design Review). - Enter estimated duration (e.g.
40 Hours), planned start date, and assign a responsible team member or skill pool. - Define dependency relationships: set predecessor tasks (e.g. Finish-to-Start) to establish the logical sequence of execution.
- Add a key Milestone (e.g.
Phase 1 Client Sign-off) with duration0and mark it as a critical delivery gate. - Switch to the Gantt Chart view to inspect timeline visualization, activity overlaps, and critical path highlights.
- Verify that schedule dates dynamically calculate and no circular dependencies or orphan tasks are introduced.
Expected result
All network activities and milestone gates are clearly sequenced and visually presented on the interactive Gantt chart with valid schedule dates.
Downstream effects
Scheduled network activities provide the direct assignment target for employee timesheet bookings (70000 / 76000) and baseline tracking for budget release (66000).
Related guides
Review 62000: Create Project and WBS, proceed to 66000: Plan Budget and Release Project, or view 64000 with screenshots.
Instructions
- Open project details from Find Projects to review tasks, phases, and resources.
- Add task activities under the respective WBS phase elements.
- Establish logical predecessors, durations, and key milestone review gates.
- Examine the visual timeline on the Gantt Chart to verify schedules and resource workloads.
Downstream effects
Accurate activity scheduling ensures reliable resource allocation and realistic project budget baselines.
Related guides
Read text instructions or proceed to 66000: Plan Budget and Release Project.